
Services / Operational Reporting
See what’s happening.
Know where to focus.
Your systems record the work. We turn that information into reporting that helps you understand delays, monitor quality and give your team a clear view of how the business is running.
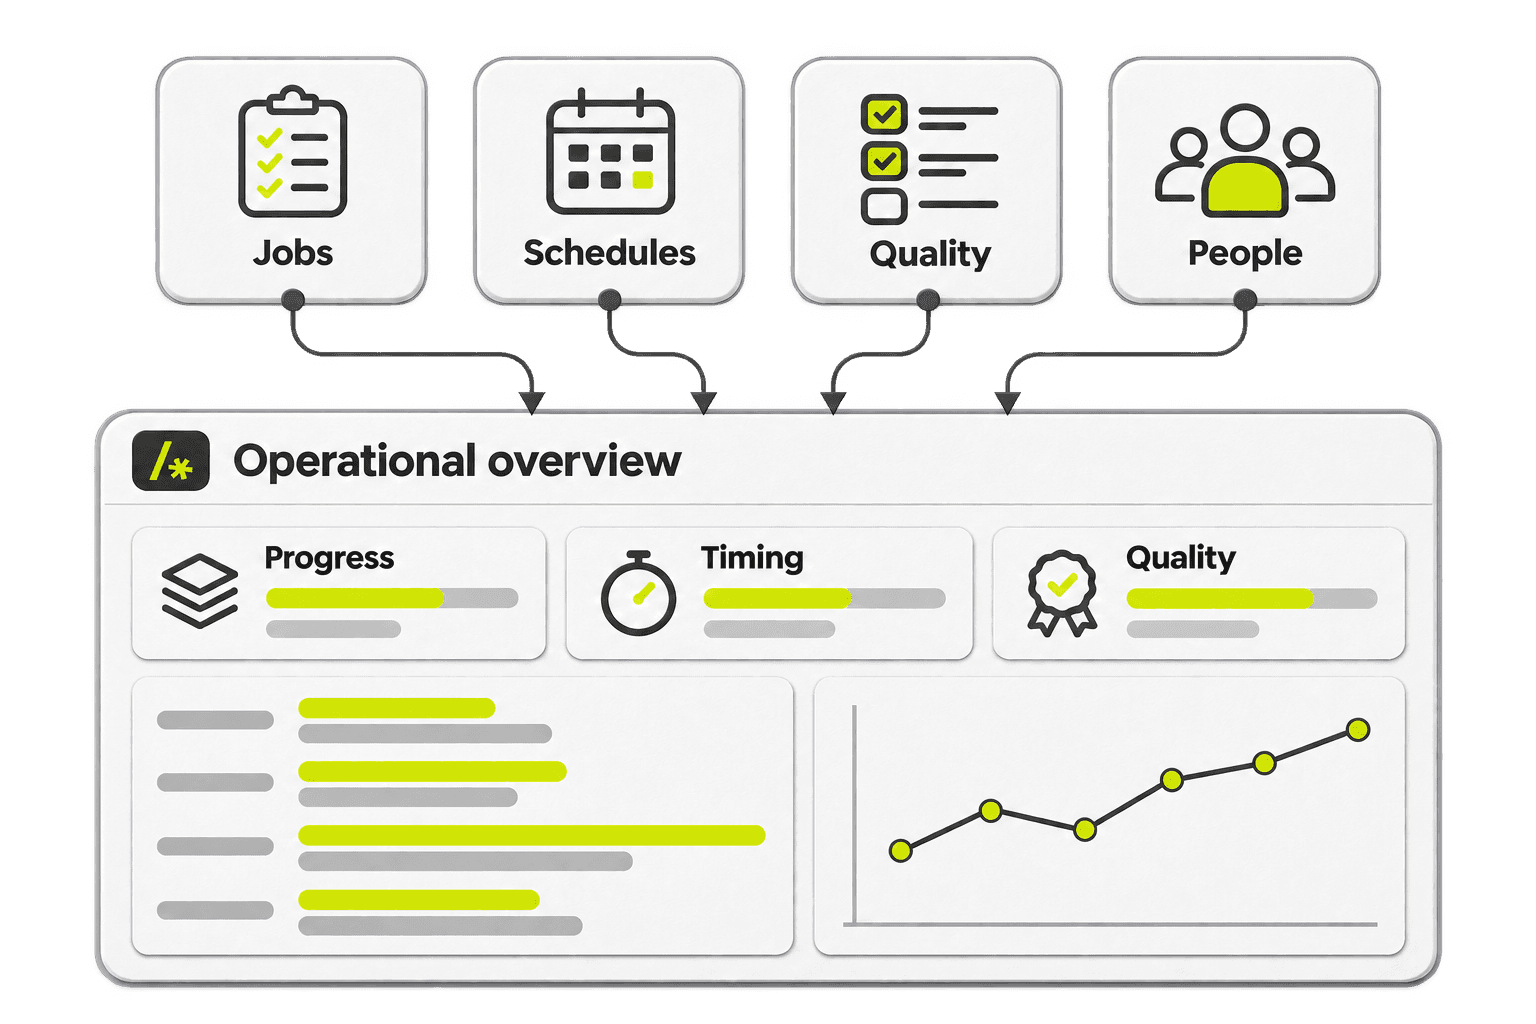
See the whole operation
Find the work that needs attention
Sound familiar?
The work is recorded.
The bigger picture is missing.
You can see a job. But not the pattern.
Your system tells you what’s happening on an individual job. Seeing which stages are slowing down across the business takes a lot more digging.
Another meeting. Another manual report.
Someone has to export, filter and combine the data before the conversation can start. By the next meeting, the report needs building again.
Fast doesn’t always mean good.
Completion dates only tell part of the story. Quality, rework and the type of work matter too, but they’re often missing from the same view.
From everyday activity.
To a useful overview.
We build a reporting layer around the systems your team already uses, connecting the detail of the work to the decisions you need to make.
Connect
Bring together the job records, schedules, progress updates and quality data needed for your reports.
Define
Agree what each measure means, how stages fit together and which differences affect comparisons.
Understand
See trends across the business, then drill into the teams, jobs or stages behind a result.
Act
Give people useful views for planning, team conversations and deciding where to focus next.
Connections and refresh timing are agreed around your source systems. We make it clear when information was updated and where a data issue needs attention.
In practice / Torsion Homes
The data was already there.
Now the team can see the pattern.
Torsion already used iHub to run its residential builds. We brought the operational data into reporting that helps Construction Manager Troy Brooks see bottlenecks, monitor handover fix-ups and focus on the jobs that need attention.
- Stage timing and handover quality in view
- Supervisor reports for individual conversations
- Company-level dashboards for office screens
“Engaging CODENAME to assist us with our reporting has been a game changer. Whilst the construction industry can be quite chaotic, we now have reporting in real time assisting us to build quickly and efficiently without compromising the high-quality standards we set ourselves.”
What we can build together
The overall picture.
The reasons behind it.
Whether you build homes, run a workshop or manage maintenance crews, we start with the questions your team needs answered. Your workflow sets the shape of the reporting.
Progress and bottlenecksSee where work is moving and where it is getting held up.
Compare expected and actual stage durations, identify overdue work and follow an exception into the individual job. Patterns across jobs can help you investigate scheduling, trade availability, workload or other constraints before deciding what to change.
Timing and quality togetherKeep delivery speed and the standard of the work in view.
Bring completion timing together with the quality measures you record, such as handover fix-ups, defects, rework or inspection results. View trends across periods and job types, so a faster turnaround doesn’t hide a growing quality issue.
Performance with contextMake comparisons that reflect the work people are doing.
Filter by team, supervisor, job type and stage. Where your data supports it, account for recorded holds, weather delays or extensions of time. We agree the comparison rules with you so differences become a starting point for a useful conversation.
Views for the people who use themDetailed team reports. A clear company overview.
Build focused views and exports for individual reviews, broader dashboards for leadership and company-level screens for the office. We agree who needs which information and configure access around those roles, so every audience can use the same underlying data.
- Business overview
See progress, timing and quality across the work you manage.
- Team and job performance
Compare the relevant teams and job types, with their circumstances in view.
- Stages and source records
Open the detail to understand what sits behind a delay or quality trend.
Move from a signal in the overview to the work that needs a closer look.
Useful comparisons.
Clear definitions.
A report is only useful if your team understands what it measures. We agree when a stage starts and finishes, how holds are treated and what counts as a quality item before building the comparisons.
We check the results against source records and review exceptions with the people doing the work. The reporting helps you find where to investigate; your team brings the experience to understand the cause and decide what to do.
Map the work.
Make the data useful.
Start with the decisions you need to make
You don’t need to start with a dashboard specification. Show us how work moves through your business, what you already record and where you’re missing visibility.
- Step 1
Understand the workflow
We map your stages, systems and reporting audiences. Together we choose the first questions to answer and check whether the source data can support them.
- Step 2
Connect and build
We bring the data together, agree the measures and create the reports. We work through examples with your team to check calculations, filters and drill-downs.
- Step 3
Validate and put it to work
We review results against real records, confirm access and refresh timing, then help your team use the reports. Further views can be added as your needs develop.
What can’t you see
in your operations?
Book a 15 minute call to talk through your systems, reporting gaps and the questions your team needs answered.