
Live Farm Cashflow Less Spreadsheet Work

How Australian grower AFG replaced hours of manual reporting with a custom system built around its farms, finances, and way of working.
- 40+hours saved
each month  Cashflow ready
when it’s needed More confidence
in the numbers
About AFG
AFG Corp Rural grows grain, vegetables, and sugar cane across Queensland and NSW. The business operates through multiple companies and trusts, each with its own finances, budgets, and shareholders.
How reporting used to work
For Scott Arthur, AFG’s owner and director, the most important thing was having a reliable cashflow forecast for individual farms and the group as a whole.
Unfortunately, that used to take a lot of manual work. First of all, each entity’s budget lived in its own spreadsheet. Actuals lived in Xero. Combining these two required the finance team to export data from Xero and stitch it together with the budgets in Excel.
Getting a complete picture of the group required even more manual work, with staff having to combine all the individual spreadsheets into one master file. As a result of this manual process, the cashflow was only ever as current as the latest round of exports.
To fix this, AFG worked with CODENAME to build a system we’ve collaboratively called ‘Budget Matrix’, bringing farm budgets and live actuals together in one place.
What changed with Budget Matrix

40+ hours saved each month
AFG reports saving at least 40 hours a month in its farming business. Less exporting, copying, and checking gives the team more time to manage the farm and plan ahead.

See cashflow shortfalls earlier
Scott and the team can see payment timing and planned spending alongside live Xero data, helping them spot tight months and adjust spending or arrange funding earlier.

More confidence in the numbers
AFG’s reports no longer rely on copied figures, spreadsheet formulas, or links between workbooks. With planned budgets and live Xero data connected, the team has greater confidence that the numbers are right and current.

Less reliance on spreadsheet experts
Building reports used to require financial knowledge and Excel expertise at the same time. Now that Budget Matrix puts the reports together, Scott and the team can focus on what the numbers mean without wasting time stitching them together by hand.

Better decisions for the farm
AFG can make better-informed decisions, whether adjusting spending, arranging funding, or changing farm plans.
Getting a reliable view of our cash position used to take days of pulling numbers together, and it was out of date almost as soon as it was done. Now cashflow, profit and loss, and the balance sheet are all there the moment I open the report. That consistency lets us make decisions quickly and with real confidence.”
How ‘Budget Matrix’ works
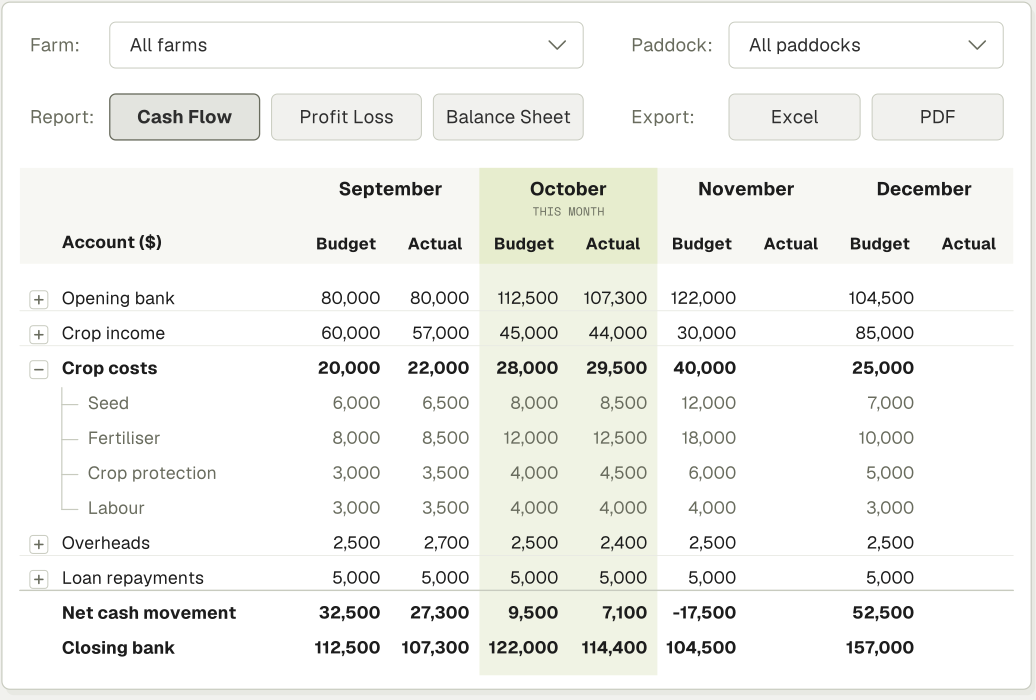
‘Budget Matrix’ brings farm plans, budgets, and live actuals together for reporting. Scott and the team plan paddocks using reusable crop cycle templates, then compare budgets with actual results synced from Xero.
- Step 1
Set up crop
templatesIncome, costs, and payment dates.
- Step 2
Plan your
paddocksApply templates to each paddock.
- Step 3
Connect
XeroSync actual figures from Xero.
- Step 4
Get the full
pictureOpen live financial reports.
| Account ($) | September | October (this month) | November | December | ||||
|---|---|---|---|---|---|---|---|---|
| Budget | Actual | Budget | Actual | Budget | Actual | Budget | Actual | |
| Opening bank | 80,000 | 80,000 | 112,500 | 107,300 | 122,000 | — | 104,500 | — |
| Crop income | 60,000 | 57,000 | 45,000 | 44,000 | 30,000 | — | 85,000 | — |
| Crop costs | 20,000 | 22,000 | 28,000 | 29,500 | 40,000 | — | 25,000 | — |
| Crop costs: Seed | 6,000 | 6,500 | 8,000 | 8,500 | 12,000 | — | 7,000 | — |
| Crop costs: Fertiliser | 8,000 | 8,500 | 12,000 | 12,500 | 18,000 | — | 10,000 | — |
| Crop costs: Crop protection | 3,000 | 3,500 | 4,000 | 4,500 | 6,000 | — | 5,000 | — |
| Crop costs: Labour | 3,000 | 3,500 | 4,000 | 4,000 | 4,000 | — | 3,000 | — |
| Overheads | 2,500 | 2,700 | 2,500 | 2,400 | 2,500 | — | 2,500 | — |
| Loan repayments | 5,000 | 5,000 | 5,000 | 5,000 | 5,000 | — | 5,000 | — |
| Net cash movement | 32,500 | 27,300 | 9,500 | 7,100 | -17,500 | — | 52,500 | — |
| Closing bank | 112,500 | 107,300 | 122,000 | 114,400 | 104,500 | — | 157,000 | — |
AFG can view cashflow, profit and loss, and balance sheets for each entity, or combine entities to get a complete picture for the group. Using farm and paddock filters, the team can also look closer at individual areas, spot where costs differ from the budget, and investigate what’s driving the difference.
When plans change or something doesn’t look quite right, the team can click into a figure and adjust the budget; reports update instantly. As an added bonus, branded PDFs and Excel exports make it easy to share the latest numbers with banks, lenders, and advisers.
More answers from the same data
By bringing all this data together in AFG's custom system, we were able to create a whole suite of valuable operational reports with very little additional effort, giving the business greater visibility into its operations.
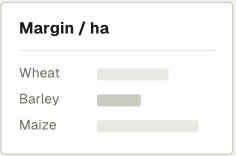
Crop Margins
Compare budgeted margins per hectare and see how changes in yield or sale price affect the result, including the price needed to cover crop costs.
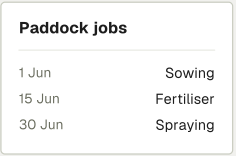
Paddock Work Plans
See which jobs are planned for each paddock and when, with the input rates and quantities needed to organise the work.
Material Requirements
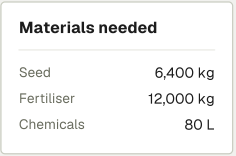
Bring planned seed, fertiliser, and chemical quantities together by crop, paddock, or input type, helping prepare orders and organise supplies.
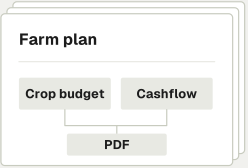
Complete Farm Plan
Combine selected crop and paddock budgets, materials, and financial reports into one PDF for each farming business, ready to review or share.
What would make your farm easier to run?
Every farming business works differently. We start by understanding how yours operates, where time is being wasted, and what could work better. Then we build a system that solves those problems, focusing on the changes that will make the biggest difference to your business.